Data strategies for future us
Data strategies are part of a shared workflow strategy: How do we structure data, where do we store and back up data, how do we create metadata, and the mantra of “keep the raw data raw” and distinct from your analysis. Here we will discuss personal and team habits for data management and sharing: data strategies for future us.
Data organization in spreadsheets
We’ll start off discussing the Data organization in spreadsheets publication by Broman & Woo, 2018, which appears in the “Practical Data Science for Stats” collection in PeerJ & American Statistician.
It is a delightful read, from the first opening sentences:
“Spreadsheets, for all of their mundane rectangularness, have been the subject of angst and controversy for decades…. Amid this debate, spreadsheets have continued to play a significant role in researchers’ workflows. The dangers of spreadsheets are real, however – so much so that the European Spreadsheet Risks Interest Group keeps a public archive of spreadsheet ‘horror stories’…”
Broman & Woo share practical tips to make spreadsheets less error-prone, easier for computers to process, and easier to share. And something incredibly cool, it’s the 3rd most downloaded stats paper in the American Statistician, behind 2 papers about p-values (twitter thread).
Read their paper for strategies behind their basic principles:
- Be consistent
- Write dates like YYYY-MM-DD
- Don’t leave any cells empty
- Put just one thing in a cell
- Organize data as a rectangle (“Tidy data”)
- Create a data dictionary
- Don’t include calculations in the raw data files
- Don’t use font color or highlighting as data
- Choose good names for things
- Make backups
- Use data validation to avoid data entry errors
- Save the data in plain text files
Good enough practices in scientific computing
Next we’ll explore this Good enough practices in scientific computing publication by Wilson et al. 2017 in PLoS Computational Biology. It follows a previous publication by Wilson et al. 2014: Best practices for scientific computing.
In terms of data management recommendation, they have 2 main themes:
- work towards ready-to-analyze data incrementally, documenting both the intermediate data and the process
- embrace the idea of “tidy data”, which can be a powerful accelerator for analysis
Read their paper for strategies behind their basic principles (Box 1):
- Save the raw data.
- Ensure that raw data are backed up in more than one location.
- Create the data you wish to see in the world.
- Create analysis-friendly data.
- Record all the steps used to process data.
- Anticipate the need to use multiple tables, & use a unique identifier for every record.
- Submit data to a reputable DOI-issuing repository so that others can access & cite.
The publication also covers:
- Software: write, organize, and share scripts and programs used in an analysis.
- Collaboration: make it easy for existing and new collaborators to understand & contribute to a project.
- Project organization: organize the digital artifacts of a project to ease discovery & understanding.
- Tracking changes: record how various components of your project change over time.
- Manuscripts: write manuscripts in a way that leaves an audit trail & minimizes manual merging of conflicts.
Tidy data for efficiency, reproducibility, & collaboration
We’ll explore the concept of tidy data through the illustrated series Tidy data for efficiency, reproducibility, & collaboration by Lowndes & Horst 2020, posted on the Openscapes blog.
When we talk about organizing data to help us work in an efficient, reproducible, and collaborative way, we are talking about TIDY DATA. We mean deliberately thinking about the shape and structure of data – something that might not seem super exciting but is truly game-changing.
Tidy data has been mentioned in each of the above, as a way to organize data in spreadsheets, to prepare ready-to-analyze data, and for sharing with the FAIR principles. And remember that “tidying data (”data wrangling”) – up to 50–80% of a data scientist’s time” Lohr 2014, New York Times, so it’s important to leverage these existing philosophies and tools.
So let’s talk about what tidy data is and why it is so empowering for your analytical life.
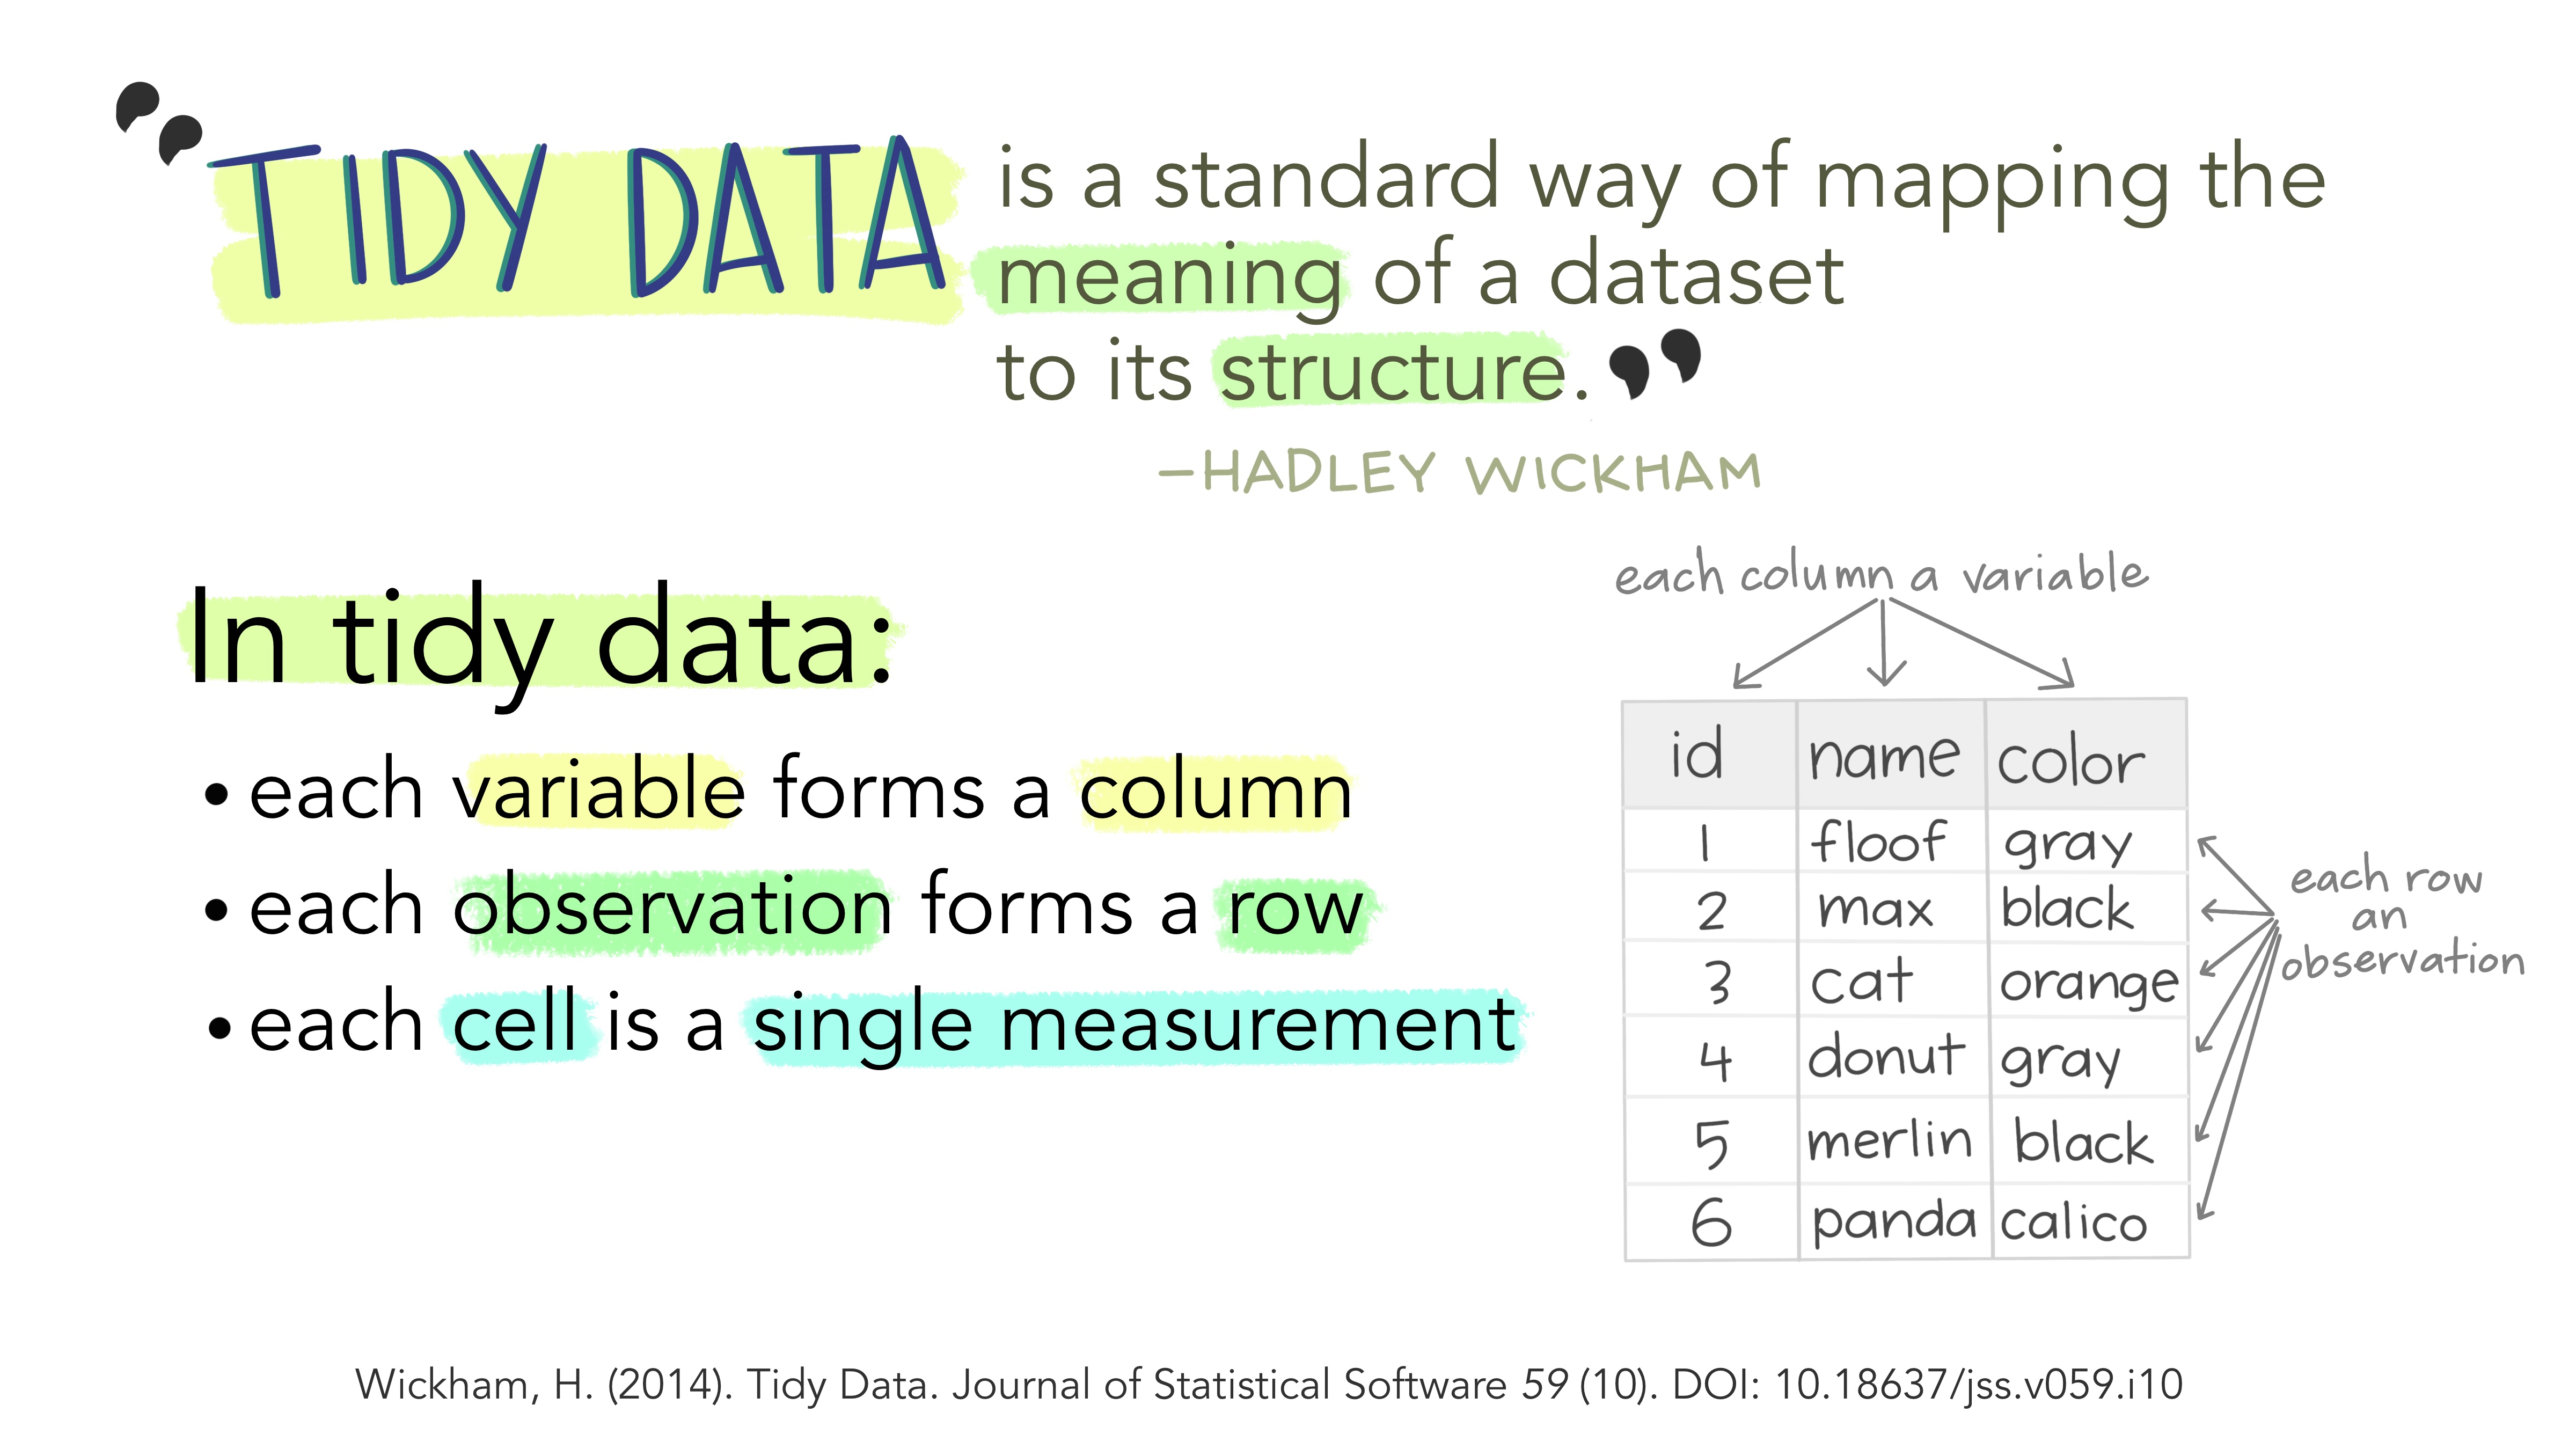
What is tidy data?
Tidy data is a way to describe data that’s organized with a particular structure – a rectangular structure, where each variable has its own column, and each observation has its own row (Wickham 2014).
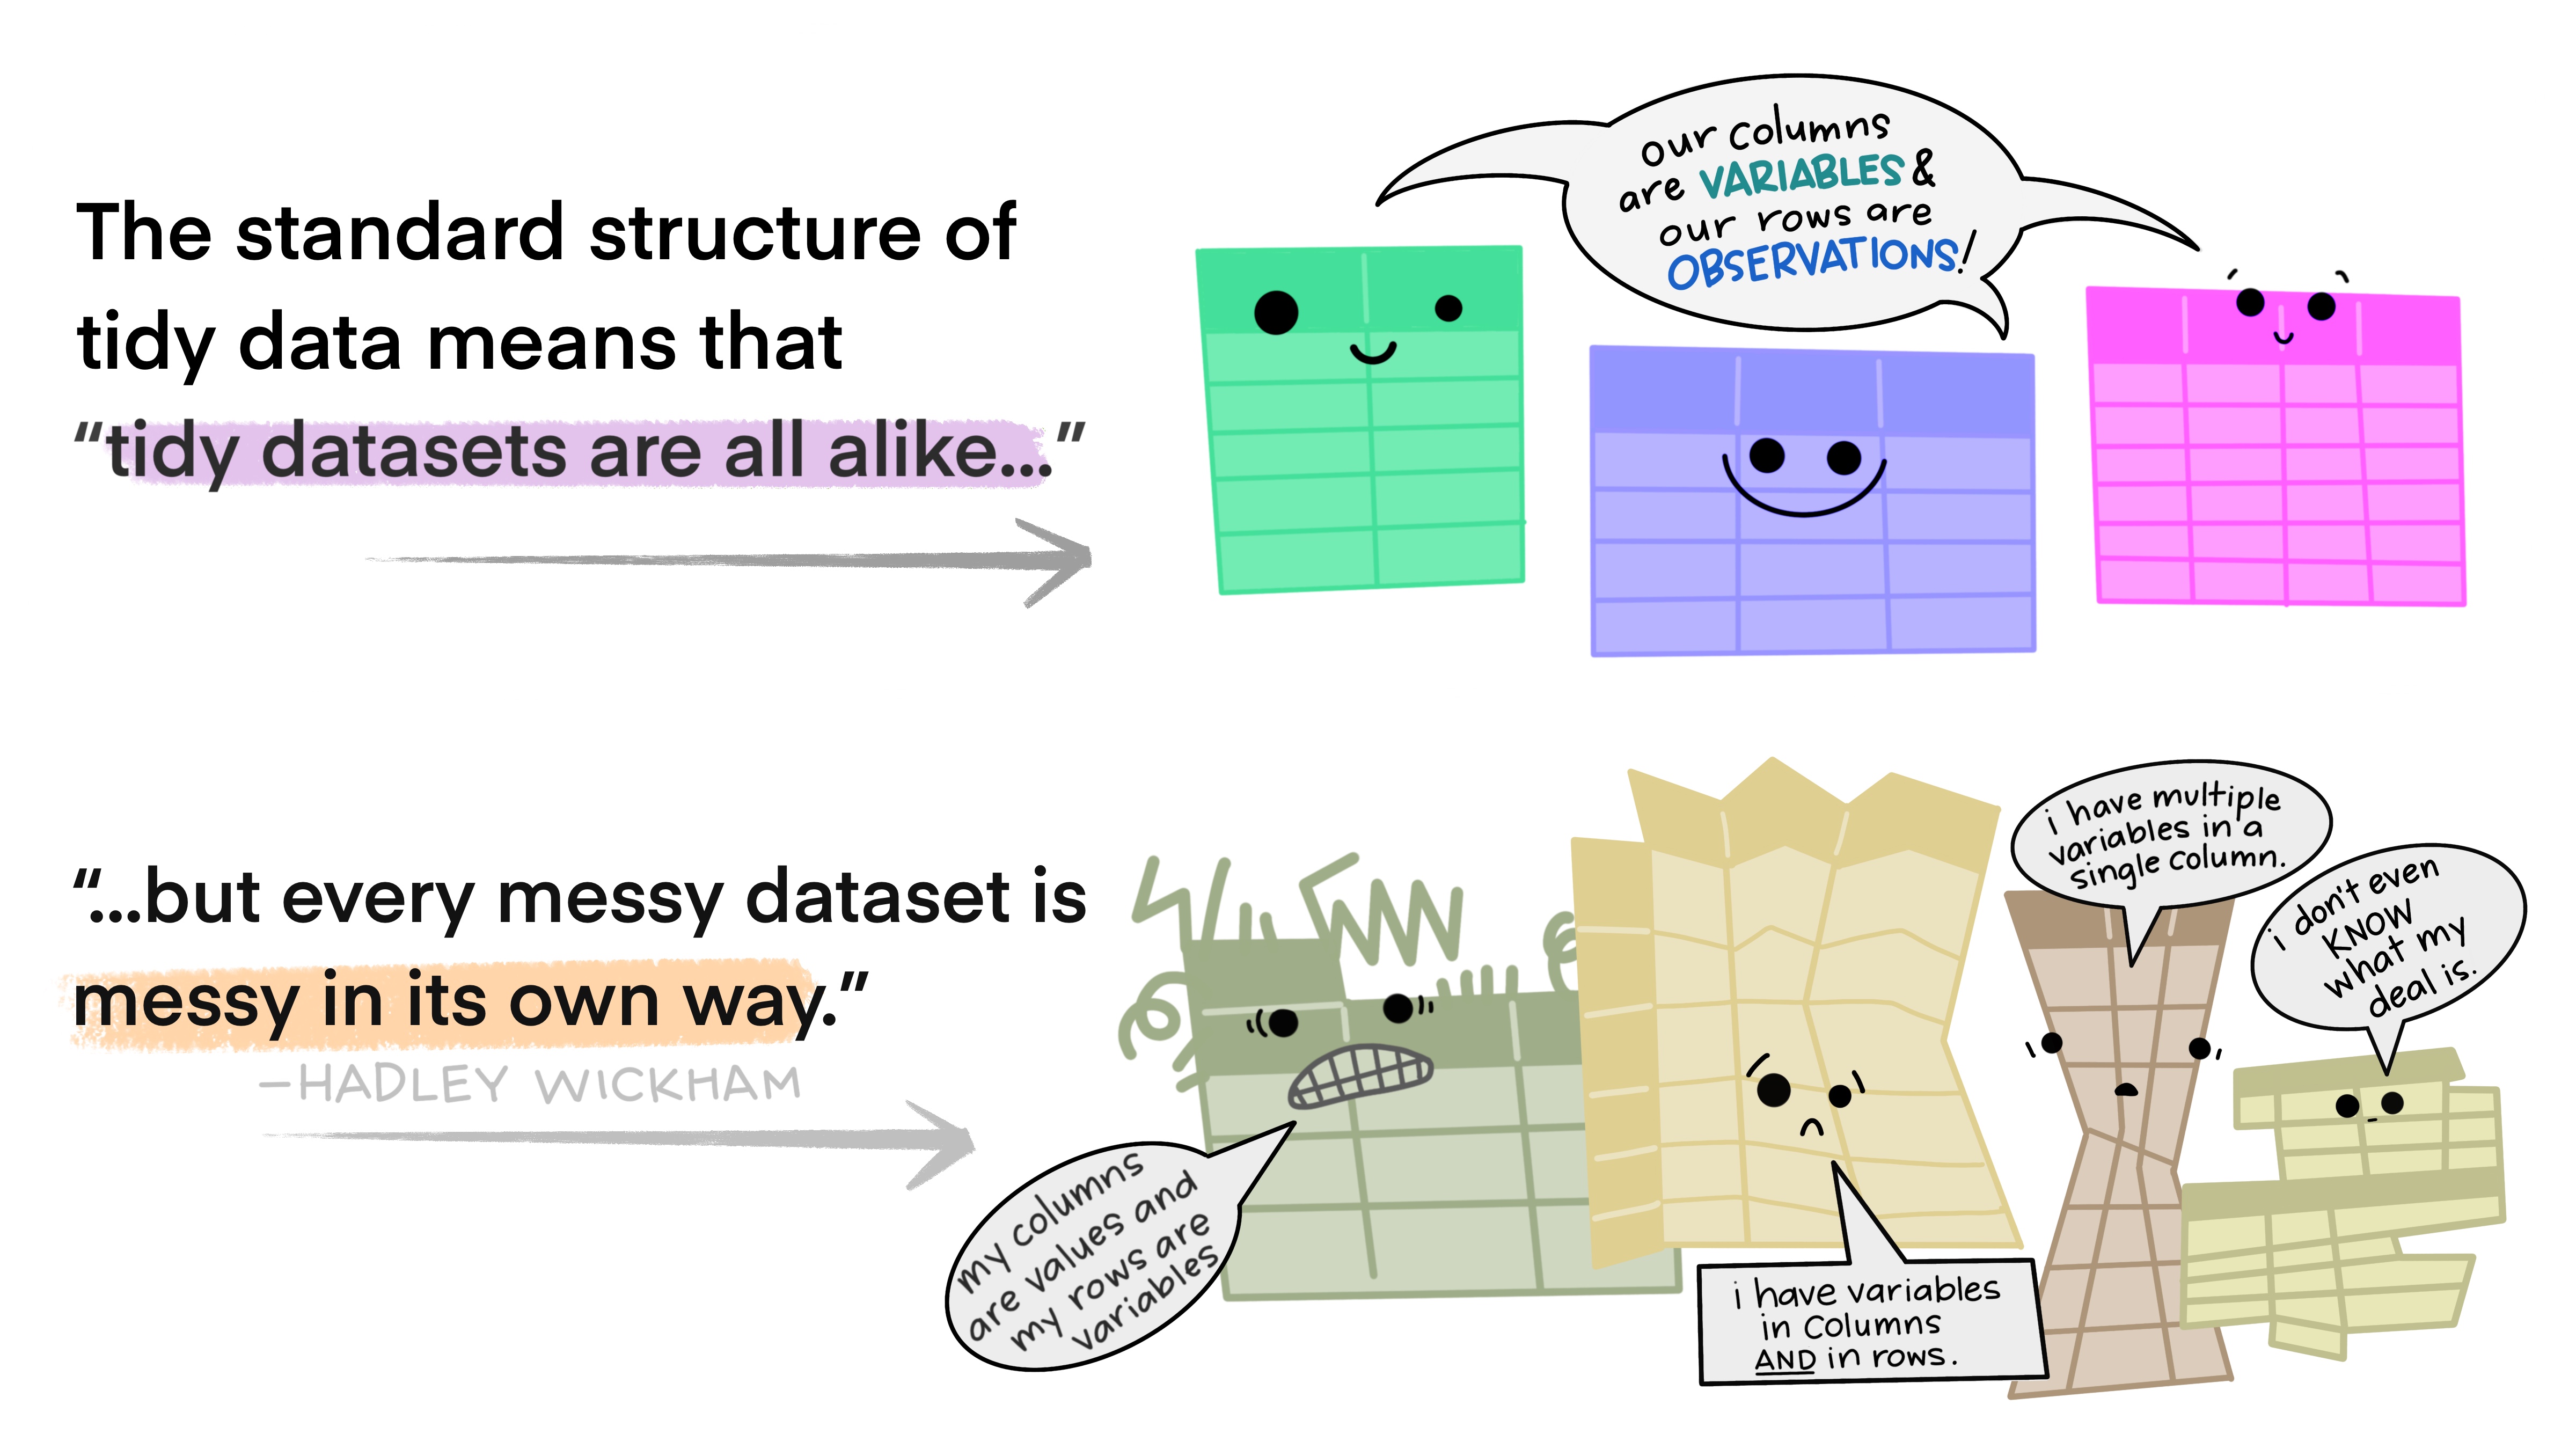
This standard structure of tidy data led Hadley Wickham to describe it the way Leo Tolstoy describes families. Leo says “Happy families are all alike; every unhappy family is unhappy in its own way”. Similarly, Hadley says “tidy datasets are all alike, but every messy dataset is messy in its own way”.
Tidy data for more efficient data science
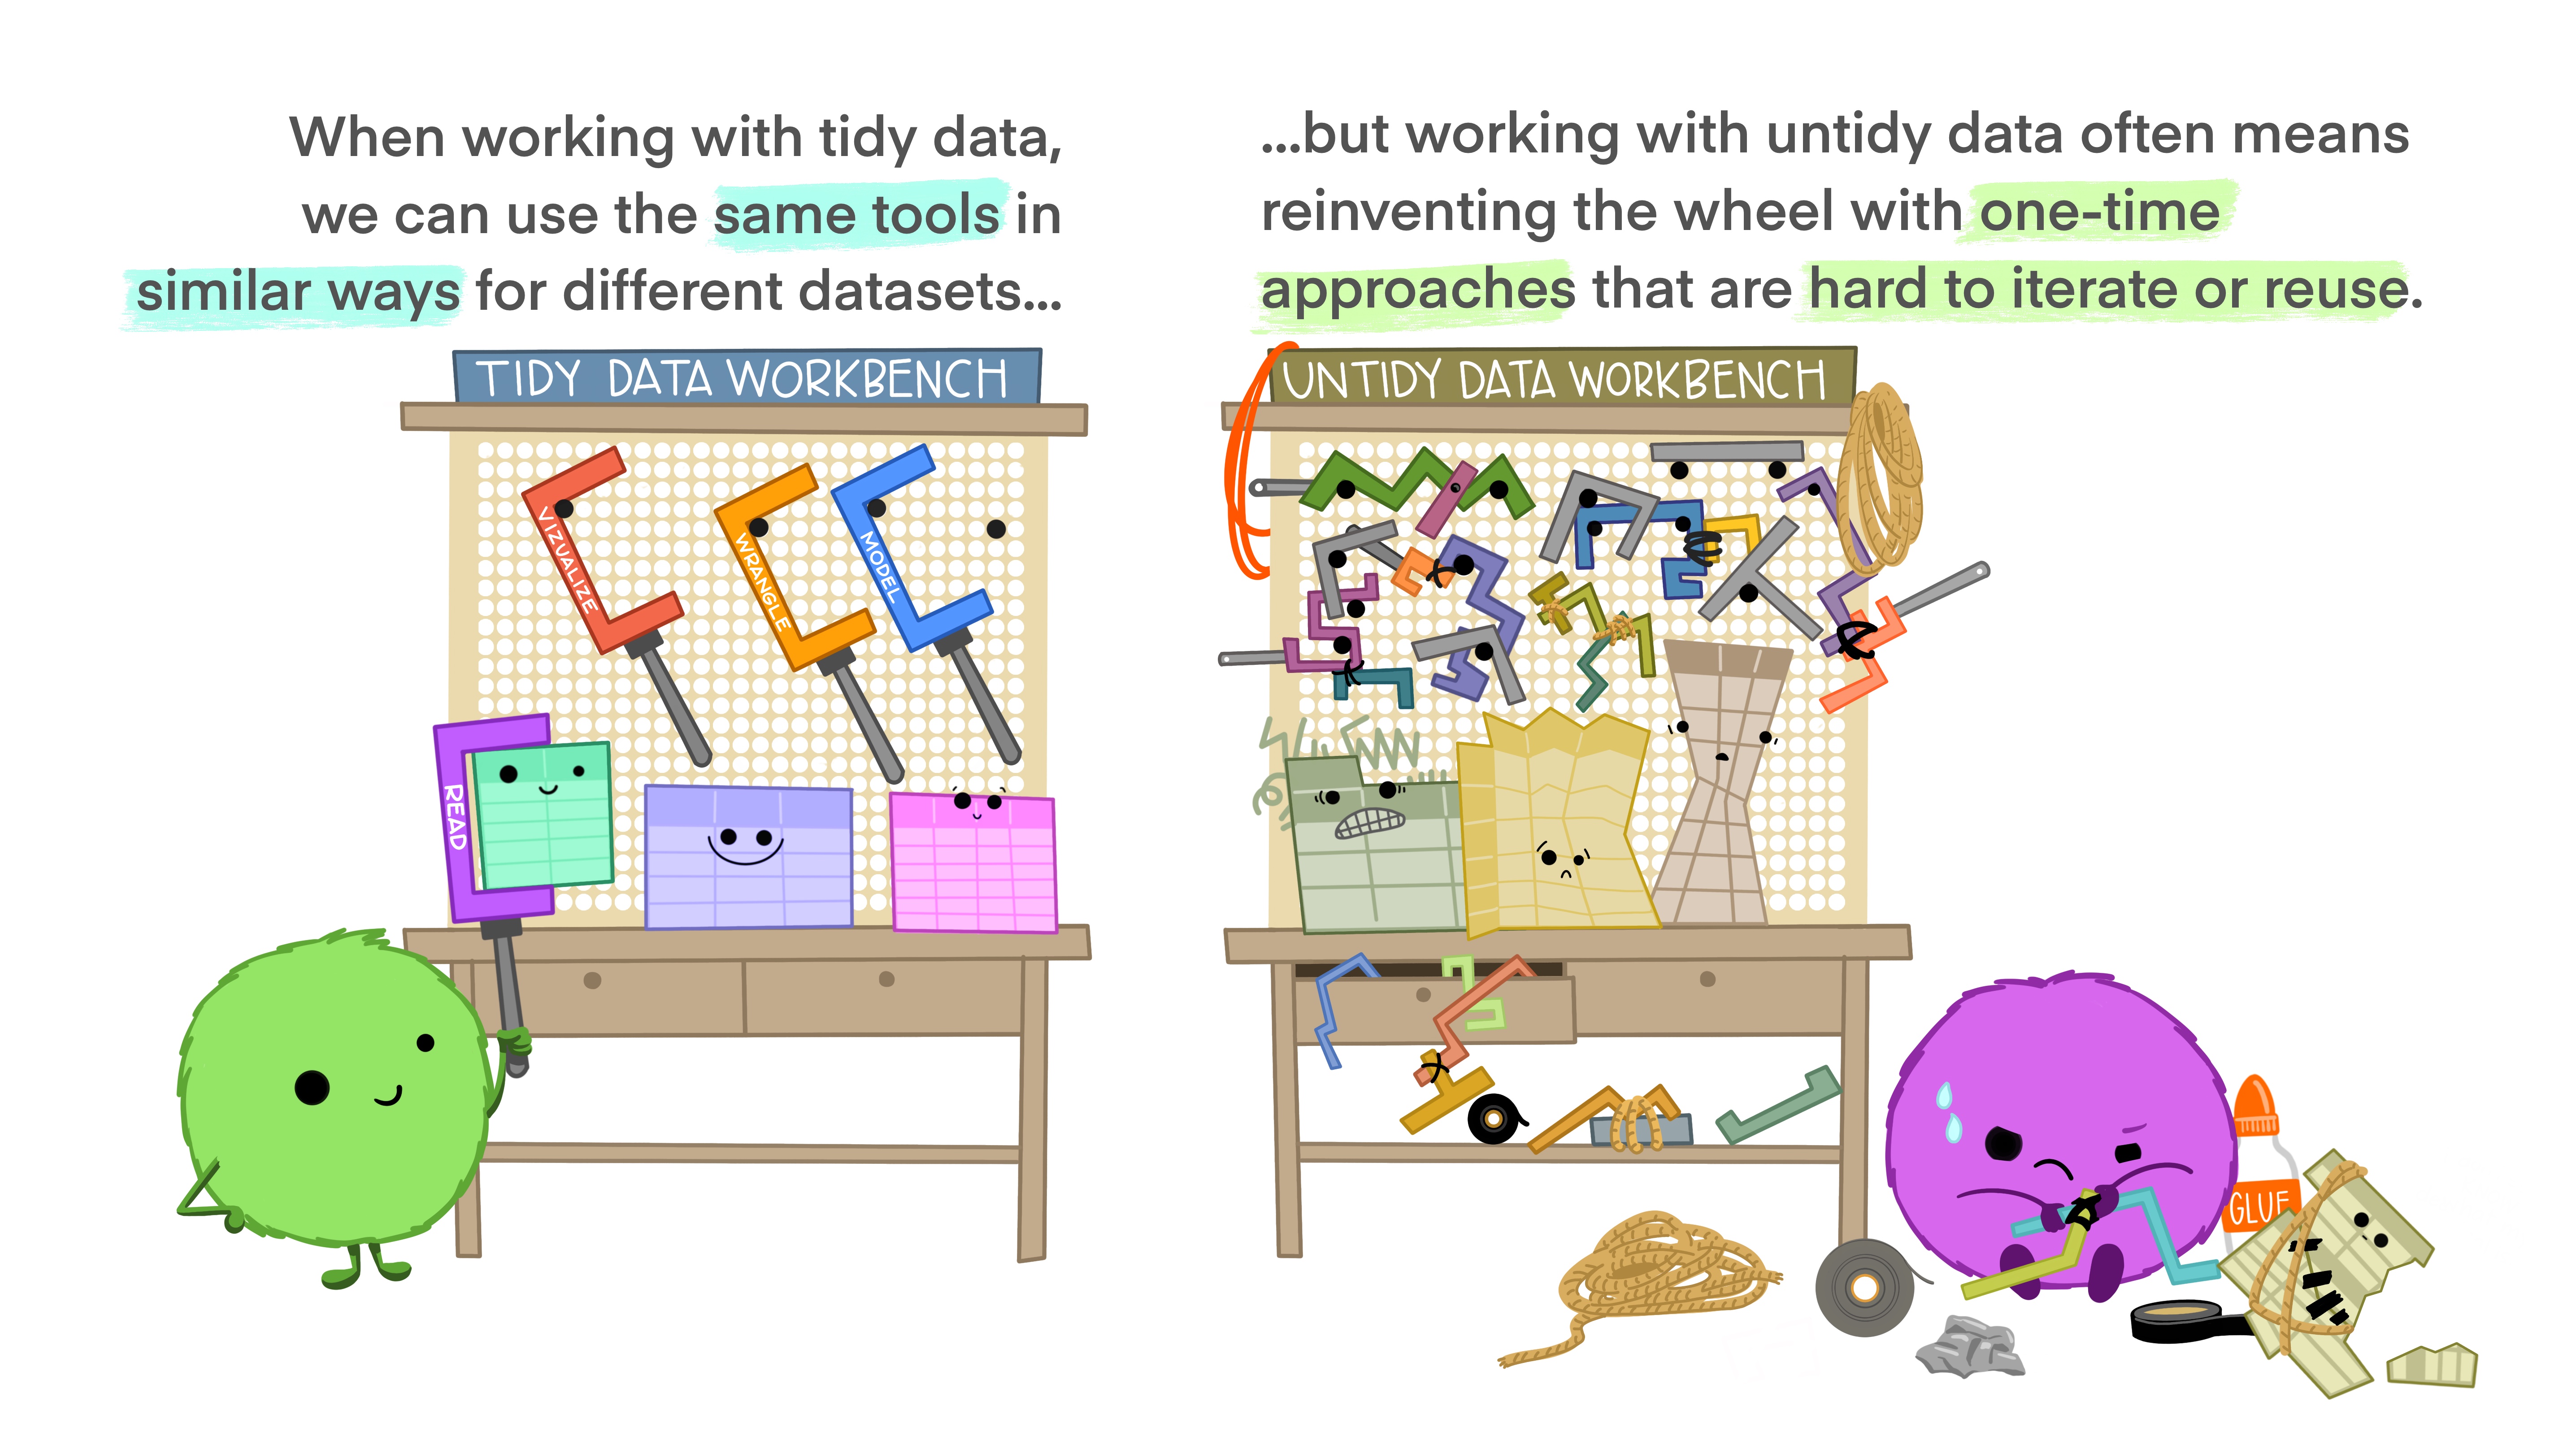
Tidy data allows you to be more efficient by using existing tools deliberately built to do the things you need to do, from subsetting portions of your data to plotting maps of your study area. Using existing tools saves you from building from scratch each time you work with a new dataset (which can be time-consuming and demoralizing). And luckily, there are a lot of tools specifically built to wrangle untidy data into tidy data (for example, in the tidyr package). By being more equipped to wrangle your data into a tidy format, you can get to your analyses faster to start answering the questions you’re asking.
Tidy data for easier collaboration
Tidy data makes it easier to collaborate because our friends can use the same tools in a familiar way. Whether thinking about collaborators as current teammates, your future self, or future teammates, organizing and sharing data in a consistent and predictable way means less adjustment, time, and effort for all.
Tidy data for reproducibility and reuse
Tidy data also makes it easier to reproduce analyses because they are easier to understand, update, and reuse. By using tools together that all expect tidy data as inputs, you can build and iterate really powerful workflows. And, when you have additional data entries, it’s no problem to re-run your code!
Tidy data for the win!
Once you are empowered with tools to work with tidy data generally, it opens up a whole new world of datasets that feel more approachable because you can work using familiar tools. This transferrable confidence and ability to collaborate might be the best thing about tidy data.
So for more efficient, reproducible, and collaborative analyses, make friends with tidy data!
Learning Resources
Wickham, Çetinkaya-Rundel, & Grolemund (2023). R for Data Science: https://r4ds.hadley.nz/
- See Ch 12: Tidy Data
Wickham, H (2014). Tidy Data. Journal of Statistical Software 58 (10). jstatsoft.org/v59/i10/
Broman, KW and KH Woo (2018). Data Organization in Spreadsheets. The American Statistician 72 (1). Available open access as a PeerJ preprint.
Leek, J (2016). How to share data with a statistician